Throughout this project, I actively contributed to both research and design, supporting the application's development from initial concept to high-fidelity prototype. A significant part of my role involved researching counter-movement jumps—a key feature of the app—and exploring future opportunities with Artificial Intelligence (AI) to enhance performance insights.
User testing was central to the process, where I gathered feedback through surveys and guerrilla testing. This feedback helped refine the app’s usability, ensuring it truly served athletes' needs. I also conducted a competitor analysis, helping shape a user-friendly and differentiated experience within the crowded sports tracking market.
I contributed to the cross-platform redesign of the high-fidelity prototype, ensuring a seamless experience across both Android and iOS. Working iteratively and responding to real user feedback reinforced my focus on adaptability, responsiveness, and user-centered design principles.
Overall, this project strengthened my skills in agile teamwork, research-driven design, and collaboration, while deepening my passion for creating user-focused technology in the field of sports science.
Project Questions
How can we effectively measure and visualize CMJ and fatigue data?
What are the best ways to deliver actionable insights quickly?
How can training trends be presented to support athletes?
Who are the ideal stakeholders for an 18–24 athletic app?
How can we ensure a seamless cross-platform (iOS/Android) UX?
Criteria
Develop a cross-platform Urban Sports Tracking app that empowers athletes aged 18–24 to easily understand and act on their performance data.
Occupation breakdown among respondents (82% students).
Participation rates across different urban sports activities.
Survey Insights
Our survey revealed that the majority of participants were students aged 18–24 engaged in urban sports such as skateboarding, basketball, and freerunning. These findings shaped our design priorities toward accessible, gamified performance tracking.
User Personas
Two primary user personas informed the design, representing the distinct needs of young urban athletes wanting better training data and a more intuitive platform.
Point of View & How Might We
Based on our research, we defined key problem statements and reframed them as design opportunities to guide our ideation process.
Empathy Map Explanation
The empathy map highlighted critical pain points and thoughts from users. Many users were confused about the functionality of the app, especially around navigation and the interface layout. The insights gathered helped prioritize user-centric design decisions, leading to improved clarity and usability.
Affinity Map Explanation
The affinity map was a key tool in sorting user research insights. By categorizing user feedback into fatigue, improvement, and user needs, we were able to identify actionable insights that directly influenced the design of the app. It helped shape the app’s features, from data presentation to usability improvements.
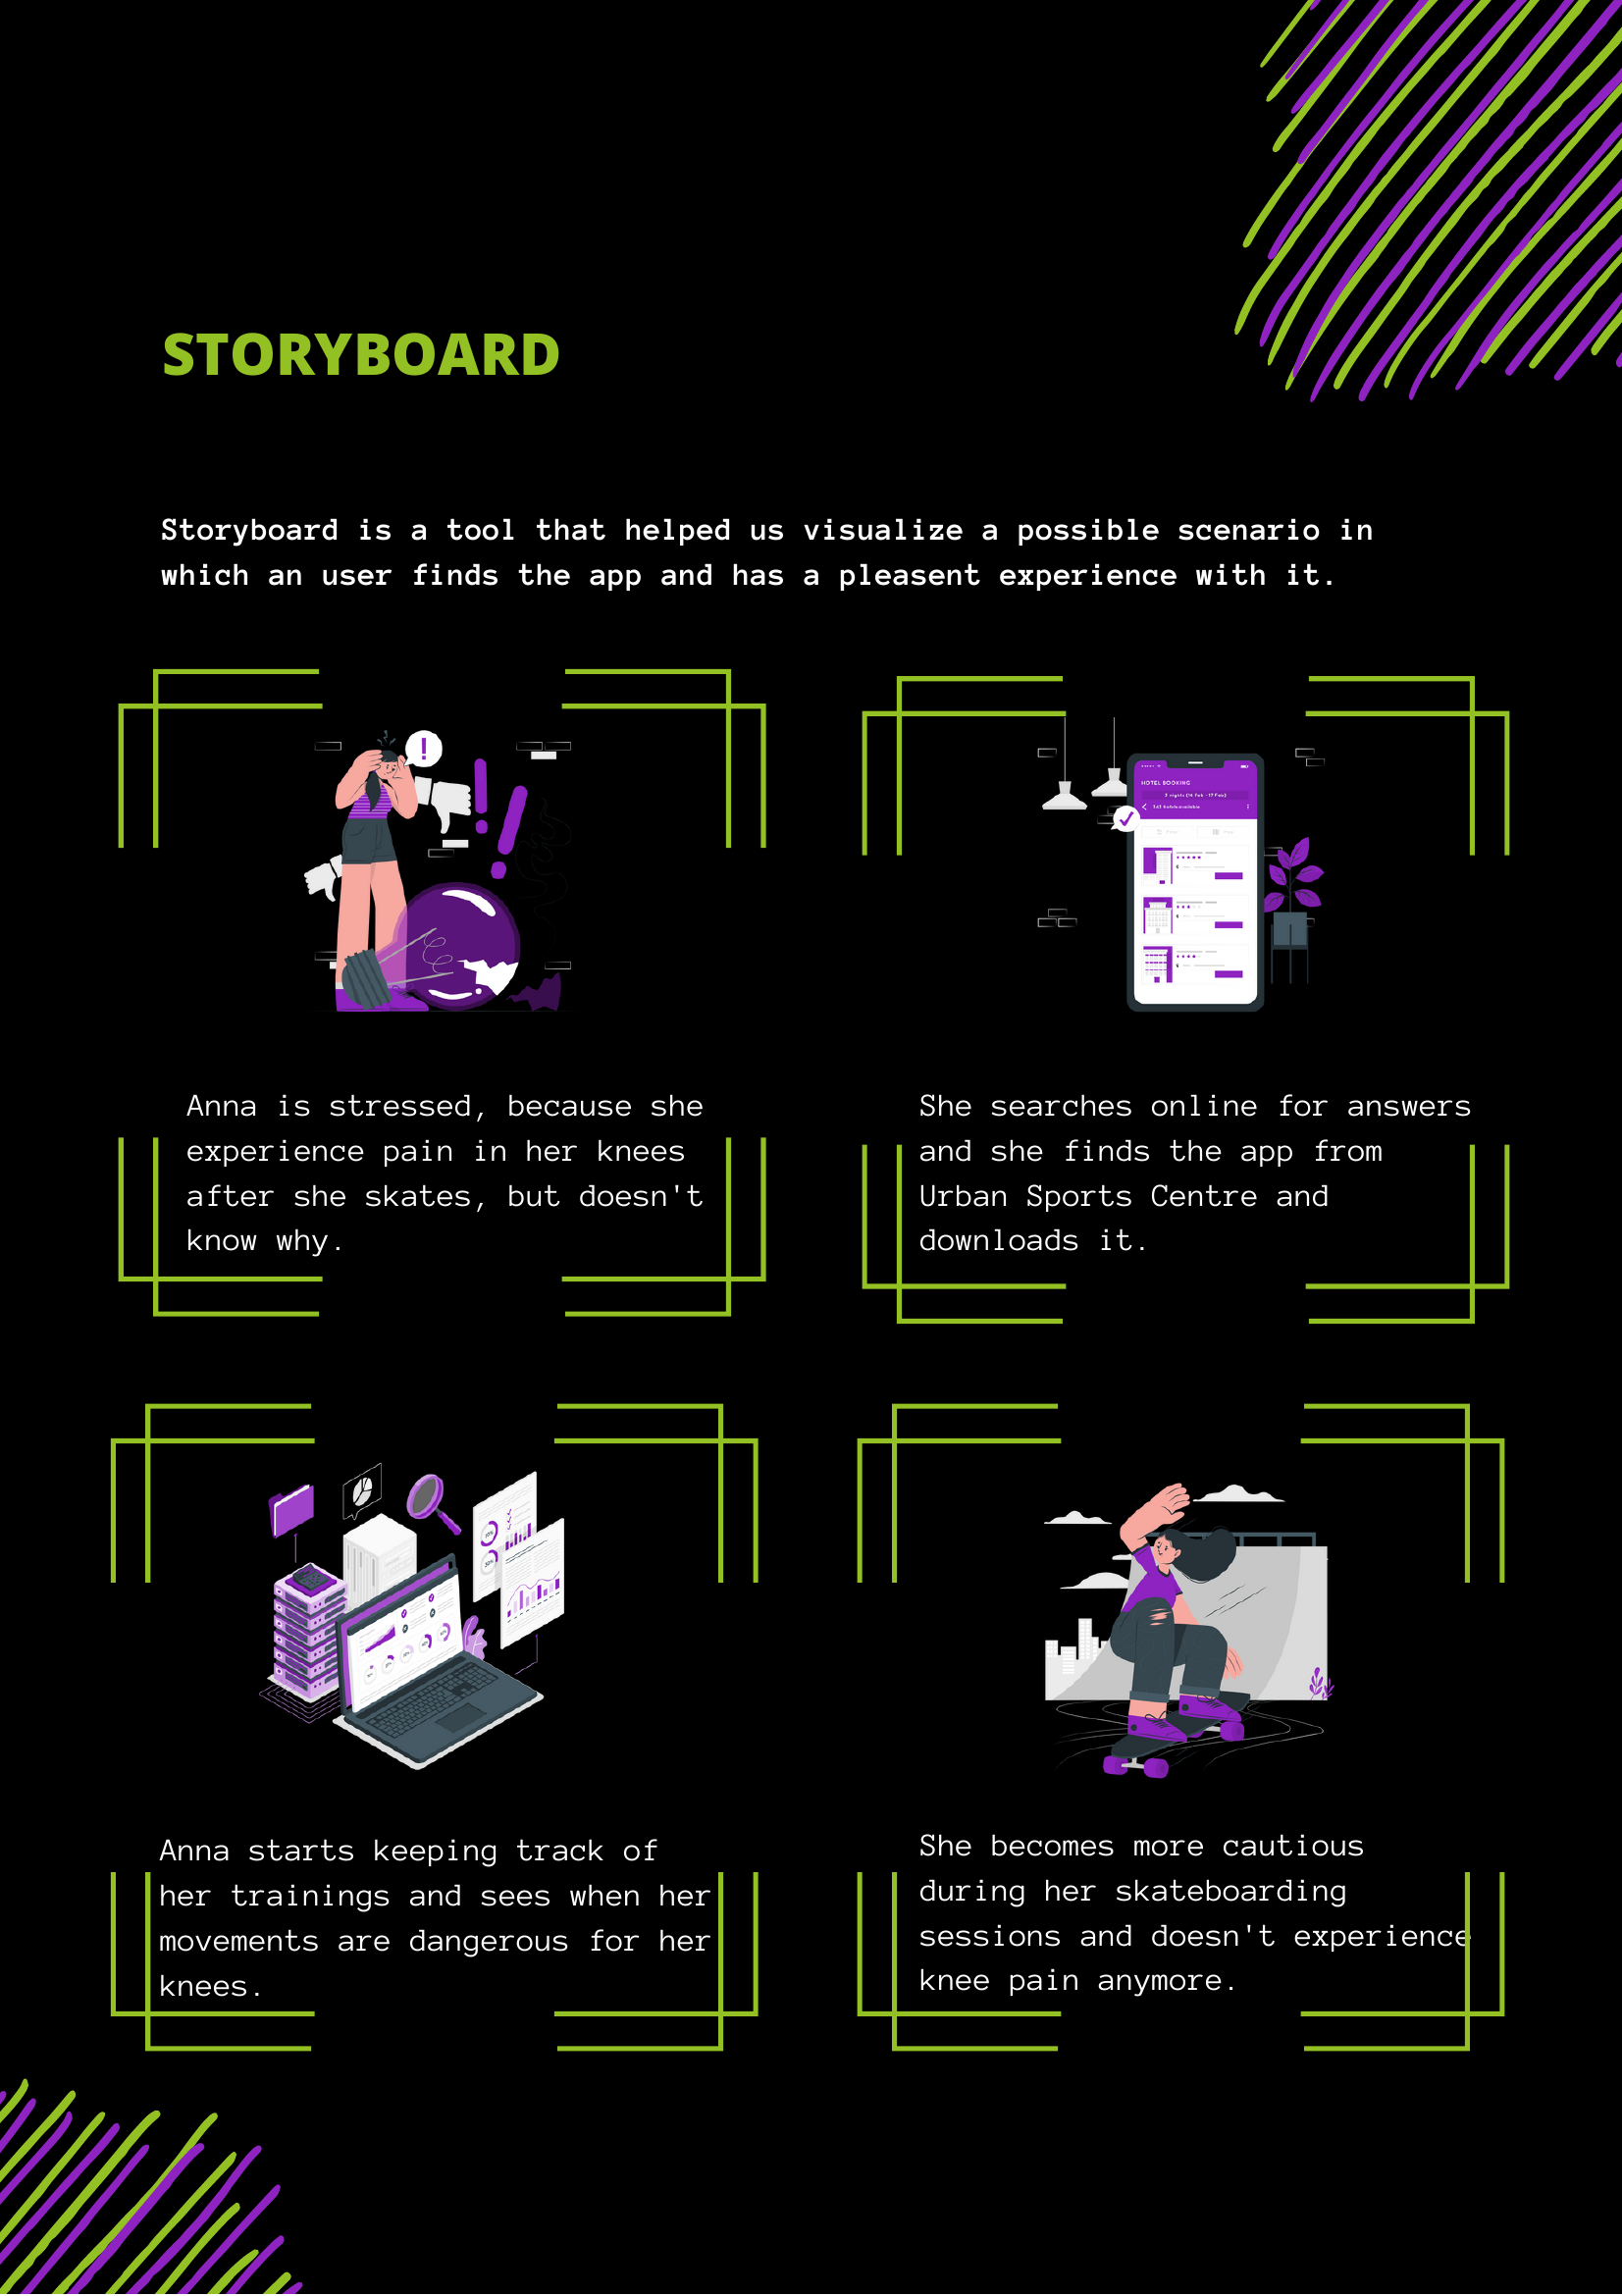
Storyboard Scenario:
Anna is stressed because she experiences pain in her knees after she skates but doesn't know why. She searches online for answers and finds the app from Urban Sports Centre, downloading it. Anna starts keeping track of her training and sees when her movements are dangerous for her knees. She becomes more cautious during her skateboarding sessions and doesn't experience knee pain anymore.
Counter Movement Jump Research
Research into counter movement jumps helped define how to track fatigue and readiness among athletes.
Loading PDF...
Page 1
1
Low-Fidelity Wireframes
To structure and visualize the product early in the design process, we developed low-fidelity wireframes that clarified the necessary screens, features, and overall user flow.
These simple layouts helped our team align on core functionalities before moving into more detailed design stages.
Loading PDF...
Page 1
1
Gorilla Testing
Quick informal tests revealed early usability issues and allowed fast improvements in UI/UX flows.
High-Fidelity Prototype
After feedback and revisions, the final high-fidelity prototype delivered a polished multi-platform experience for urban athletes.
Loading PDF...
Page 1
1
AI Research
I explored how AI could predict fatigue and injury risk, offering future directions for app innovation and athlete safety.